- One set of evacuation orders lifted in Caldwell County after wildfire contained
- 'We gutted every building' | Chimney Rock rebuilding after Hurricane Helene
- 'We gutted every building' | Chimney Rock rebuilding after Hurricane Helene
- Debris from Hurricane Helene provides fuel, complicates containment for spring wildfires
- David & Nicole Tepper increase Hurricane Helene relief commitment to $750k
Weather IQ: Why La Niña causes the most active hurricane seasons?

Historically, the La Niña phase of the ENSO cycle has produced the most active seasons on record. Here is why, and which historic years were driven by “the girl.”
CHARLOTTE, N.C. — Some of the most active Atlantic Hurricane Seasons on record had one thing in common… La Niña. Let’s raise our Weather IQ about “the girl” and how that part of the ENSO cycle affects the number of hurricanes.
What is the Enso Cycle?
The ENSO cycle or El Nino Southern Oscillation affects weather around the world and starts here around the Equator in the Pacific ocean.
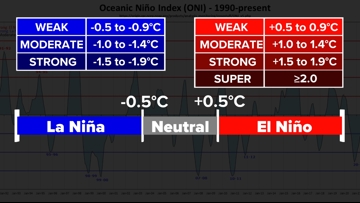
If the average sea surface temperatures (based on 3-month increments) are over 0.5°C warmer than normal, we are in an active El Niño. Values under -0.5°C are classified as La Niña and anything in between (-0.5-0.5) is neutral or La Nada.

During a La Nina there is more rising air in the Caribbean and around the Gulf of Mexico. This means more thunderstorms and tropical potential.
This flow also supports the trade winds coming from the Africa Coast, pushing more tropical waves into the Atlantic, which often turn into hurricanes
Wind shear (the changing of wind direction and/or speed with height) hinders hurricane development because Tilting the vertically stacked cyclone will weaken it. But during La Niña, there is overall less wind shear, giving the advantage to tropical development.
The Data:
The most Active year on record was back in 2020 spawning 30 named storms besting the historic 2005 season by two.
Both seasons started off neutral but ended in a weak to moderate La Niña.
2005 was historic for Katrina alone but it was also the strongest. Producing twice the average strength, according to measurements we call the Accumulated Cyclone Energy.
Where of the 10 strongest seasons since 1950. 9 out of 10 were either neutral or La Niña. And the 10 most active seasons since 1851, 6 of them were during La Niña.
On average a La Niña phase will lead to roughly 4 more hurricanes than normal, increasing the odds of landfall and history making storms.